Portal, clear data and
simple decisions
The heart of the ecosystem: management, monitoring and participation in one space. Clear data, connected devices and integrated consultancy for simple decisions in real-time.
Clarity + Security + Participation + Real-time
One portal, two perspectives
Dedicated views for managers and participants, with clear permissions and real-time data.
Manager, coordinate and distribute
Clear rules and readable reports. The system reports anomalies and suggests improvements. Documents and digital signatures in a single, always updated area.
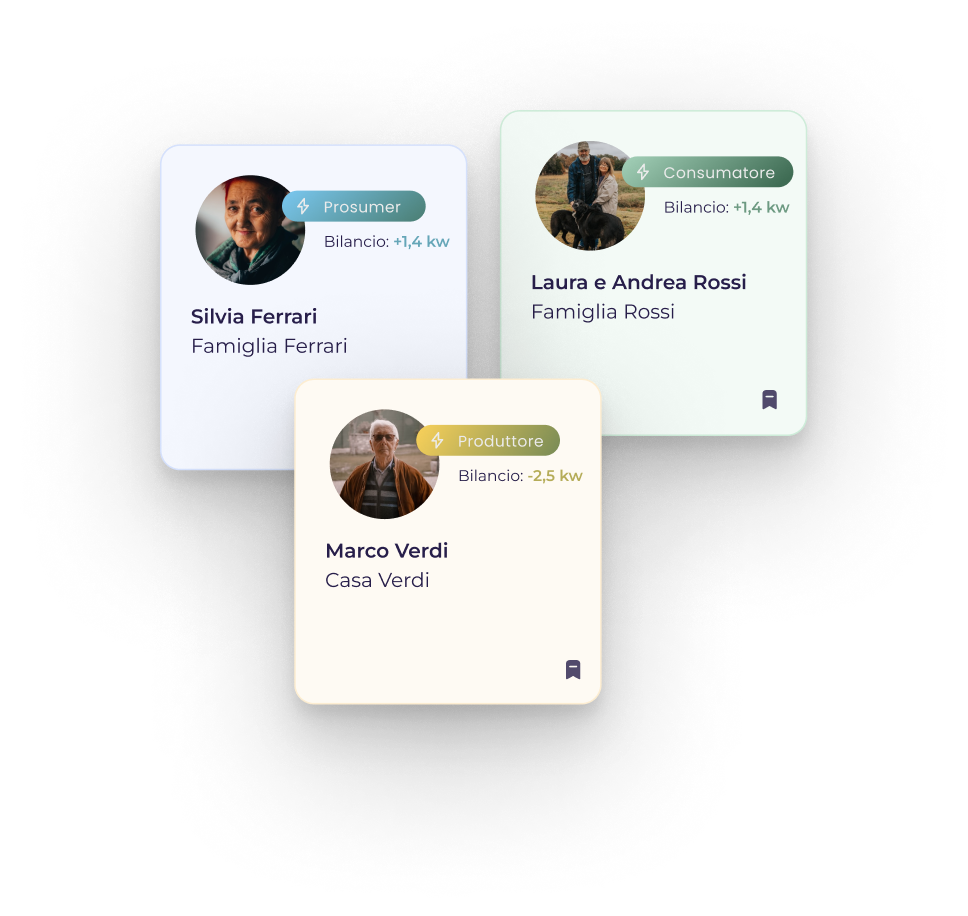
Participate, monitor and get rewards
Consumption and production always visible with updates every 5 minutes. Participate in challenges and rankings, access rewards and services. Receive useful notifications and manage your documents.
Administer your community with clear data, simple tools and shared choices. Connect Lucci and Spinì, integrate consultancy and partnerships and transform data into concrete value.
Real-time participation and control
Dedicated views for managers and participants, with clear permissions and real-time data.
Value to the community
Energy arena to reward sustainable choices
Control on every screen
Live monitoring
to use energy better
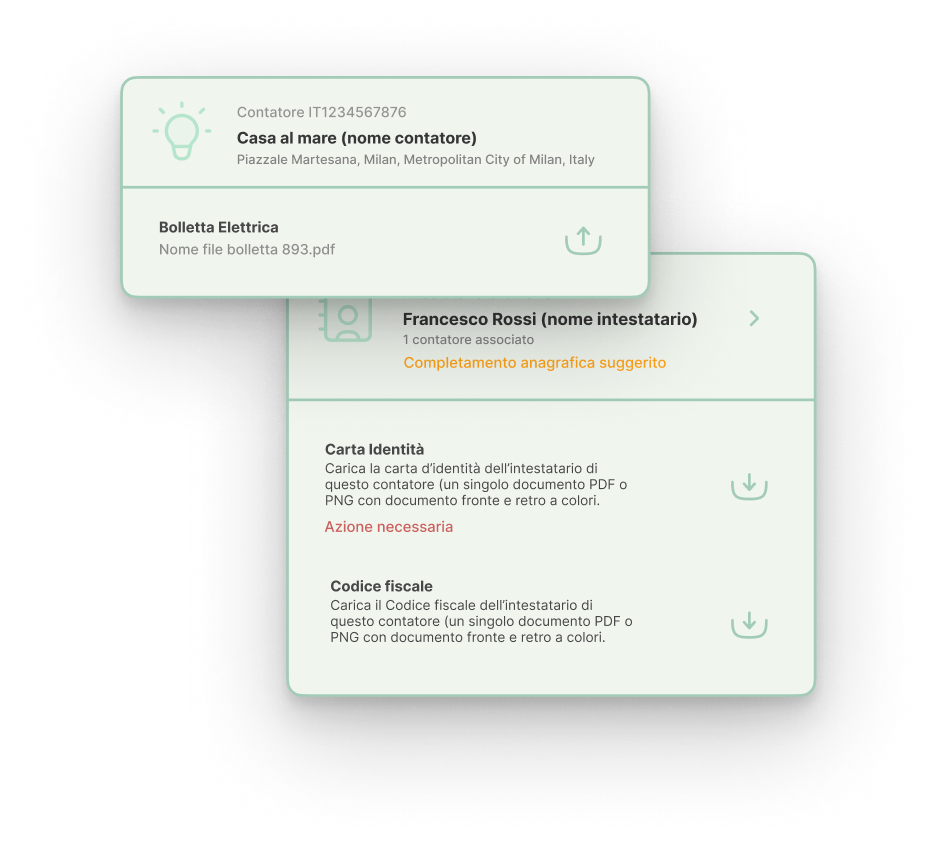
Documents in order
Simple and traceable document management
What you can do with the Portal
Charts, document workflow, reports and notifications to understand, decide and improve when needed.
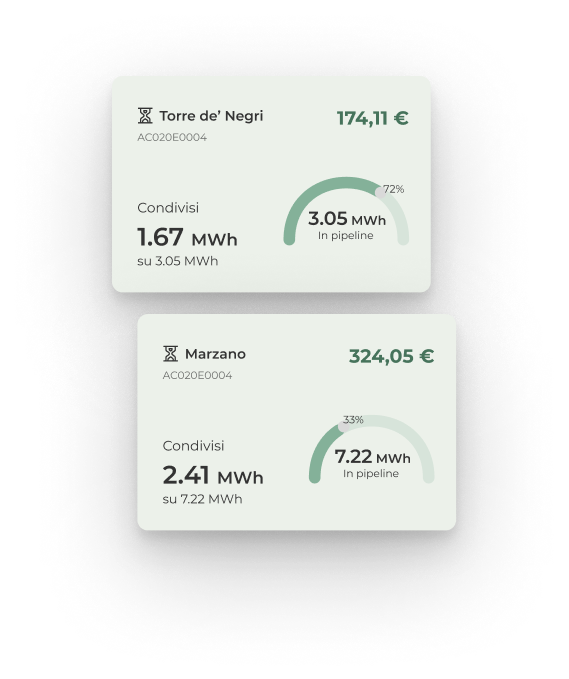
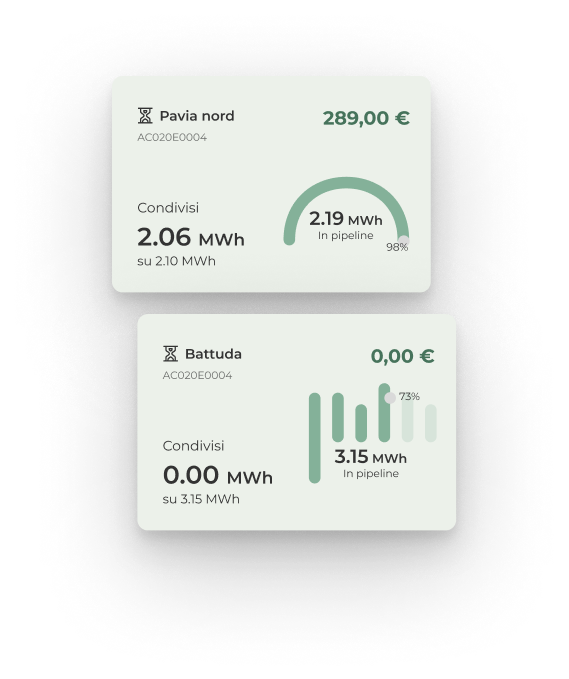
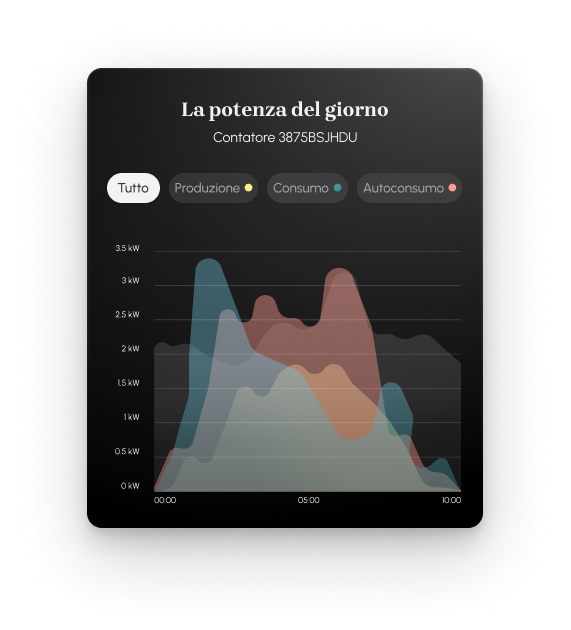
Charts and energy profiles
See the energy profiles of individuals and the aggregate of the community with high-resolution data. Monitor shared energy, consumption, production, battery and grid exchanges.
For Managers
Analyze peaks and losses, compare periods and users, export charts for reporting.
For Participants
Understand when you consume the most, how much self-production you use and how to shift loads to save.
Documents and workflow
Reports and incentive distributions
Notifications and suggestions
Request a Portal Demo with Francesco
In 30 minutes explore key features, see real cases and define next steps for your community with Francesco Viggiano, Chief Technology Officer (CTO).